
Locating and Analyzing Beach Wrecks Through Citizen Science
Problem Description
The North Carolina Office of State Archaeology (NC OSA) wished to update their beach wreck tracking methods. Currently, beach wrecks are tagged with information about the beach wreck program and the NC OSA’s information printed on the tag. Some of the tags date back decades. With the advent of easily accessible GPS tracking technology through smart phones, web applications such as Survey 123 can be utilized instead to track beach wrecks. The purpose of this project was to create a web survey with geospatial tagging that would allow citizen scientists to scan a QR code on new tags attached to beach wrecks. The survey would ask for the tag number, date, geolocation, and an uploaded photo. The data would then be downloaded into an enterprise geodatabase every week through the use of a Python script.
Analyses Procedures
Since beach wrecks could potentially have multiple surveys for that week an aggregation technique was used. Two separate datasets of the downloaded data were kept: the original, unaltered version, and the aggregated version. The aggregated version was created by exporting the most recent downloaded data in the dataset by date. A unique id was created for each of the tag numbers by creating new attribute columns for the month and year and concatenating them in another new column with the tag id. Then the aggregate polygons tool was used to find all records with the same unique id in a 30 ft area. This was used as it was the most commonly viewed accuracy tolerance seen in the Survey 123 app. The points with the polygons were erased except for one to represent the tag for that week. Those outside the polygons were appended to the aggregate points. The points were then exported to the geodatabase and then appended to the final dataset. All previous files except for the two datasets: the original and the abbreviated version, were temporary and therefore deleted. The process from downloading the data to the geodatabase to the creating the abbreviated version were created as a python script in order to be automated as the NC OSA saw appropriate.
In order to assist in tracking changes in the data for non-GIS specialists in the department, I created six tools. The first allowed users to select a North Carolina coastal county and date range, identify the beach wreck records tracked within the time frame. The second allowed users to track the movement of the beach wreck by tag number within a user-defined date range as a line connecting the point data. The third, fourth, and fifth tools allowed users to conduct statistical analysis by North Carolina county continental shoreline, barrier island, or the total North Carolina shoreline. The buffer area was split into three categories of owned land: federal, state, and private. For future analysis, I suspect most beach wrecks will be tagged on public land. Area was determined by a created buffer region that stretched one mile landwards from the shoreline and one hundred feet past the shoreline waterside. The third gave users the ability to see whether the beach wreck placements were statistically significant. The fourth allowed users to find the mean center of sites placement. The fifth allowed users to find the directional distribution by user defined standard deviation of one, two, or three standard deviations. The last tool allowed users to update the frequency count of the beach wrecks by land ownership, name of the land (i.e. National Wildlife Refuge), and total count of tag numbers. Data used for the third through sixth tools was the previously recorded beach wreck data which was recorded from the 1970s to the early 1990s. As real data from current beach wrecks will not be conducted until after the completion of the project, dummy data was used for the first two tools.
Results
As data will not be gathered until after the completion of the project, the sample data downloads to the enterprise geodatabase and is edited correctly. The tools work well for all data types needed for the project.
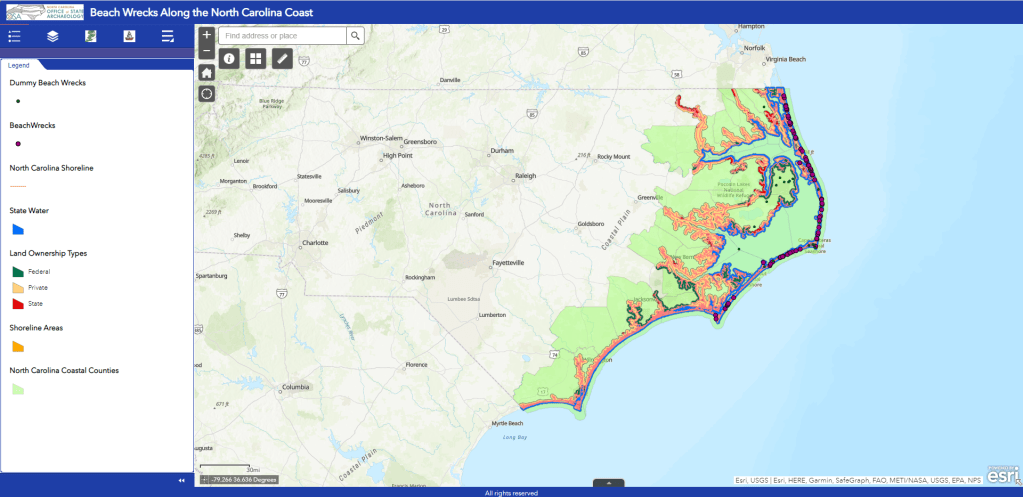
All Layers in the Application 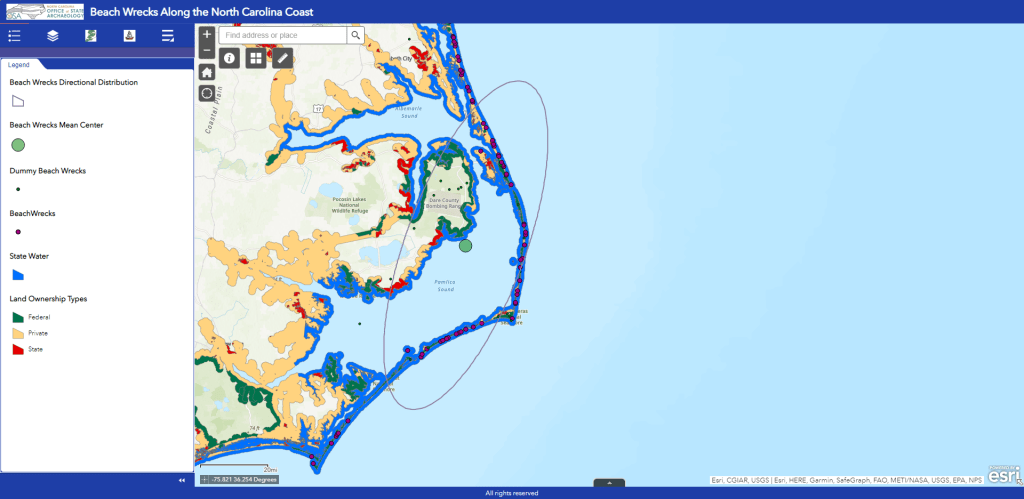
Center Mean and Directional Distribution for all Beach Wrecks
Link to site is here: https://arcg.is/1yym1u.
Capstone Reflection
The capstone project utilized all GIST competencies needed to achieve a functional project. Python programming language was incorporated for the client’s future automation. Additionally, several web services were created from Survey 123 to ArcGIS Online (AGOL) Web Applications to custom-made geoprocessing tools. Data was created and curated in an enterprise database, and geoprocessing models were utilized to edit incoming data and statistical analyses. The capstone experience enhanced my knowledge in designing custom-made geoprocessing tools for use in AGOL web applications, creating more complex modeling procedures for continual use in downloading and curating the data, and formatting and maintaining an enterprise geodatabase. As data gathered by AGOL web applications becomes more common, utilizing complex means to maintain and curate the data in enterprise databases is important. Additionally, creating hosted geoprocessing tools on web applications allows non-specialist GIS users access to analyses they might not have permission to do on the desktop versions. I greatly appreciated the opportunity to create a new method for my client to gather data and subsequently evaluate it.
