
Bear Suitability Analysis for the Great Smoky Mountains National Park
Problem Description
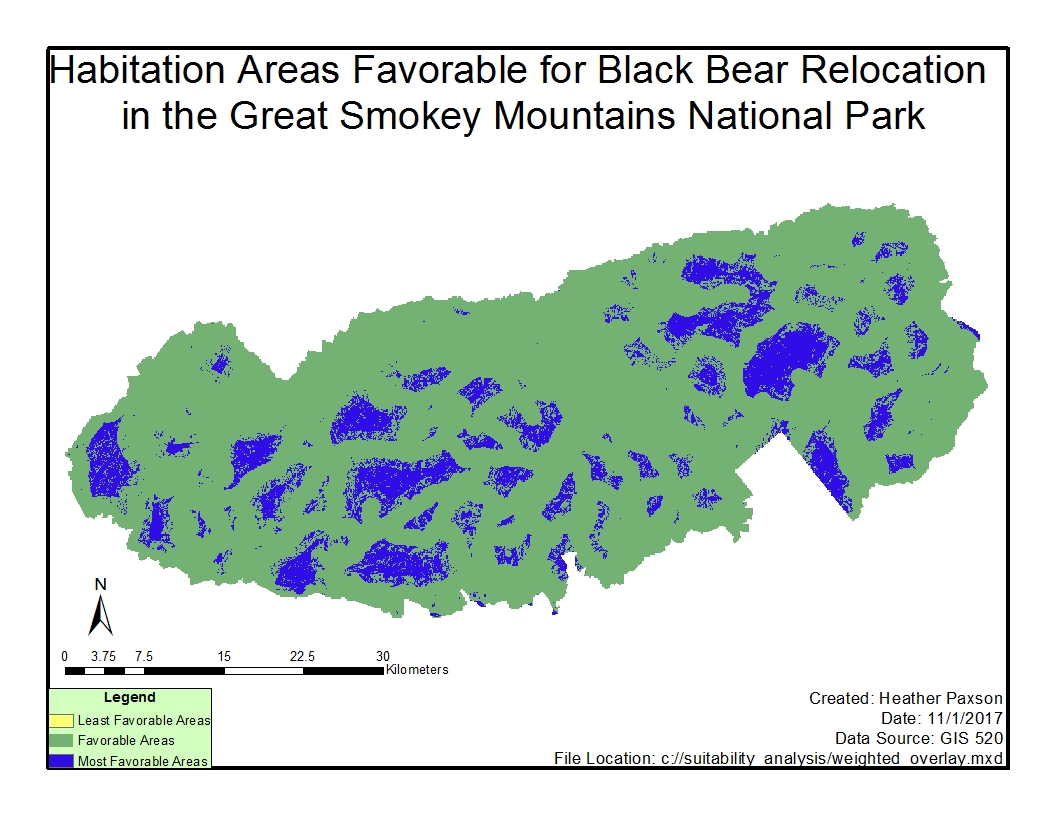
The project was to determine the safest habitat for bear relocation within the Great Smoky Mountains National Park. Previously, many incidents occurred in the park between the bears and humans, which is dangerous for both parties’ safety. Bears that are used to human interaction are a danger to themselves and the humans they encounter. Therefore, a suitable area for bear relocation was required. By utilizing the knowledge of where interactions occurred and the best habitat variables for bears, a degree of suitability was calculated, and a map designed to locate where the best relocation sites occurred.
Analyses Procedures
The locations of streams, roads, trails, vegetation, and land elevation were several of the key variables in determining site suitability. The other key variable was slope, calculated through the use of the Slope tool. Euclidean distance was determined for the roads, trails, and streams. All variables were reclassified to house a specific weight through a common scale, and then the Weighted Overlay was calculated.
The most important features for bear suitability were a high distance from roads and trails, a low distance from water, low slope, and grape thickets within the vegetation. All files were reclassified so that the most suitable areas were awarded a score of 3, moderately suitable a 2, and least suitable a 1. The subsequent weighted overlay gathered all reclassified features as input and the function was set to “1 by 3 by 1”.
Results
By reclassifying variables on a determined scale, this allowed users to easily view the preferable variables in a mapping output. The resulting map displayed the most favorable sites for relocating the bears which are far from the trails. The least favorable are near the edges of the park and trails which would involve more probability for human contact.
Reflection
The use of the reclassify tool allowed the easy comparison of selected variables. This, in turn, allowed variables to be weighted by the discretion of the user. This technique will allow for suitability analyses of multiple kinds. With the city of Raleigh rapidly growing, this can help pinpoint areas that will be included in construction of residential buildings, which in turn, can facilitate suitability analyses of connected businesses such as grocery stores.
____________________________________________________________________________________________________________________________________
Identifying Historical Sites Susceptible to Sea Level Rise along the Cape Fear River, North Carolina
Problem Description
Sea level rise due to climate change will greatly affect all aspects of coastal life, including the eventual submergence of buildings. Historical sites are one of these types of buildings, and it is exorbitantly expensive to migrate buildings. Besides coastal flooding, river level rise due to increased storm weather will also affect changes in coastal areas. The purpose of this project is to identify at-risk sites within the Cape Fear River area in North Carolina, particularly the historical areas of nearby Wilmington. A list of historical sites taken from the North Carolina Office of State Archaeology was utilized as a proxy for areas where historical areas are located. By calculating flooding through subsequent 10-foot levels based on an estimated river elevation, the number of sites submerged by each increase of river and sea level flooding was calculated.
Analyses Procedures
Digital elevation models (DEMs) were taken from NC One map and were combined into one DEM to represent the entire Cape Fear River area. Missing data in the DEM was “filled in” through a moving window. The list of historical sites was clipped to fit this area. A watershed model was created for the Cape Fear River area through the prior calculation of the flow direction, filled sinks, new flow calculation, and an estimated river outlet. To calculate river flooding, I created a very simple model. I decided that the base water elevation was 3 m, as it was the base elevation in Wilmington, where the majority of the sites was located. Each subsequent flooding output would be added on from that determined base elevation.
Results
As you can see from the table, after a 20 ft increase in water height, there is substantial increases in sites submerged in the Cape Fear River area. As the river height increases more sites further away from the river and further upstream at a higher elevation become submerged. While this is a basic model, it does demonstrate the role elevation plays in how water flows in storm events.
Reflection
The project demonstrated how DEMs can be used in conjunction with vector data in modeling real-life events and estimating water variables, such as water flow and flow calculation. Prior to this project, I had not created my DEM datasets from other DEMs and cleaned the data for analysis, which enhanced my knowledge of data modeling with elevation. It is important for GIS professionals to understand the concepts behind spatial modeling and the further application of the data.
