
Utilizing PostrgreSQL to Design a Database for Fish Species in the George Washington Birthplace National Park
Problem Description
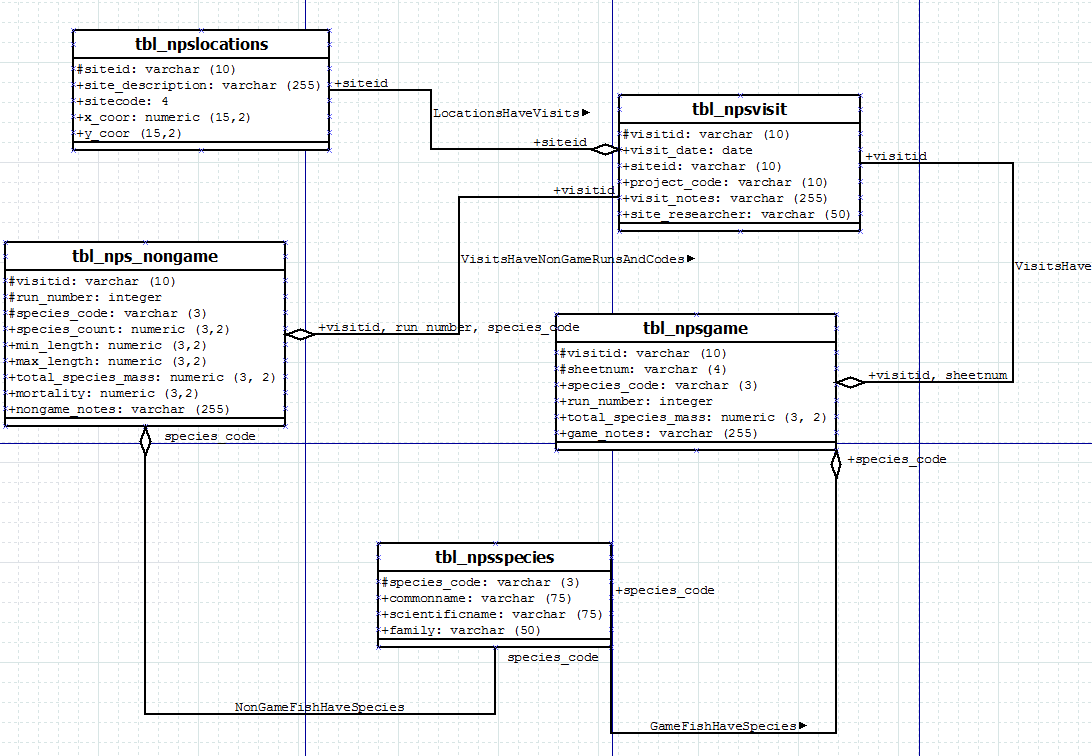
The purpose of this project was to create a database that contained the multiple tables housing information about the fish sites in the George Washington Birthplace National Monument (GEWA), fish site visits, and the non-game and game fish species observed.
Analyses Procedures
The recorded observations included a description of the tables and their relationships. From this, the observations were utilized to create an entity-relationship diagram that demonstrated the attributes for each table, the primary or composite keys, and the defined relationships between tables. Then, a UML diagram was created, which was further converted to DDL statements using ActivePerl. This allowed the data to be imported into a database management software–in this instance, pgAdmin–which included attributes and relationships. Lastly, a set of DML statements was developed to import the tables into PostgreSQL.
Results
From the previous steps, the five tables and the associated relationships were imported into a PostgreSQL database without issue. The listed tables were site locations, site location visits, observed non-game fish, observed game fish, and fish species’ names.
Reflection
The focus for this project was that it allowed me to comprehend how database relationships and the related keys work, as well as the process for importing tabular data into a relational database management system–in this case, PostgreSQL. Since project data may not be given to GIS professions in the required relationships, understanding how to create a related tables of the factors is an essential skill.
____________________________________________________________________________________________________________________________________
Job Creation through Tabular and Geospatial Data
Problem Description
As GIS specialists, we are often given tabular data and requested to display it spatially. This can be accomplished through creating a relationship between the tabular data and the geospatial features through a common value, defined through data cardinality. Basic geospatial tools will allow the tabular data to be joined or related to the attribute tables of spatial features, allowing users to incorporate the combined data for further analyses or mapping. For this study, the results of an industrial extension job survey were combined into the spatial data in a geodatabase to display the number of jobs created within NC Senate and House district boundaries.
Analyses Procedures
The analysis procedure included several tools in order to join the tabular jobs survey data with spatial layers describing zip codes and district boundaries. As each zip code could have many new jobs, summary statistics were computed on the jobs table to calculate the sum of all jobs created in each zip code. Next, the summary table was joined to the zip code layer utilizing the common zip code field as the joining attribute. Lastly, a spatial join was performed between the zip codes layer, which included the sum of jobs created, and the district boundary layers.
Results
Job creation maps were designed for both North Carolina house districts and North Carolina Senate districts. Both maps present job creation categorically.
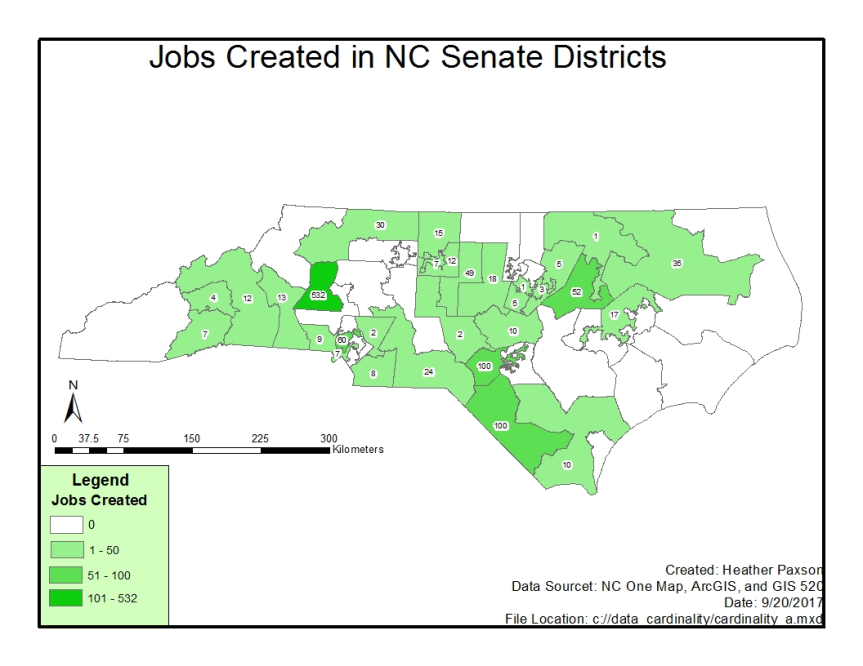
Map Output for Job Creation in NC Senate Districts 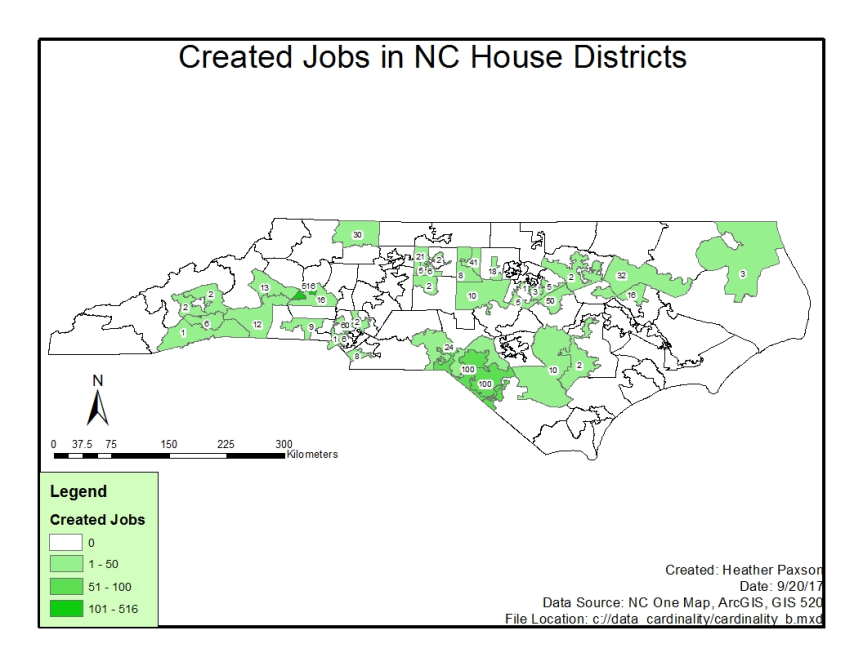
Map Output for Job Creation in NC House Districts
Reflection
For this project, I gained a better understanding of data management, particularly database relationships and how data can be utilized to connect non-spatial data to geospatial layers. After this project, I have used this technique many times in the MGIST program for manipulating data including my programming project. In my professional work as a GIS Technician for the city of Raleigh, I have used this to combine tabular survey responses based on zip code to geospatial zip codes within the North Carolina counties of Wake and Durham.
